Monday, September 27, 2010

Updated GA Evolution - Now with Weekly Data, Goals, Optional Metrics

Over the last few weeks, I have made some improvements to GA Evolution. The functional changes were pushed last Friday and this morning I added a quick YouTube Video to the login page to better help show users what the app is all about.

Here are the highlights of the changes:
  1. Improved performance and session handling (faster is better with less errors)
  2. I have included Goal Data which can be reported as either Goal Completions or Goal Conversion Rates
  3. The metrics columns are now optional so users can build the report that they really want
  4. Report data can now be broken out by week besides by month
As always, enjoy and please pass along feedback on the app. 

Link to original GA Evolution post

Link to GAEvolution web app 


Monday, September 13, 2010

Google Instant Makes Insights + Suggest Extension even more Valuable

Now that Google has turned on Google Instant (I am not a fan yet, but I could perhaps get used to it), the importance of Google Suggest has increased greatly because now they do not only give you a suggest search, but now give users suggested results.

In making this change, it is even more important that SEOs and other interested users understand and analyze the most popular searches that will be forced on suggested to users of Google Search.

The Google Suggest 4 Google Insights for Search Extension makes it easy to quickly compare and view the popularity (as well as rising/popular related searches, and regional interest) of the searches that Google is most likely to execute in the process of writing a normal query.

See the original post to learn more and download the extension (for Chrome and Firefox)

Friday, July 16, 2010

Goal Funnel Exit Values in Percentages - New Userscript

In the Goal Funnel Visualization report of GA, it paints very nicely all of the users who flow in and out of the typical conversion path. One thing that I thought it was missing, however, was to show the exit numbers in percentage terms.

It has always shown the top 5 locations to where a user "abandons" a certain step of the conversion funnel, but I am someone who really likes looking at data in % values, not only in absolute values.

So, here is a simple little script that calculates the % value for each of those top 5 exit pages for each step. The % is the number of exits to a specific location divided by the total # of visits to that specific goal funnel step. Enjoy.
I like % values
Instructions for installing the script in Firefox

Thursday, June 3, 2010

Check Page Layout w/ the Horizontally Optimized Layout Tool

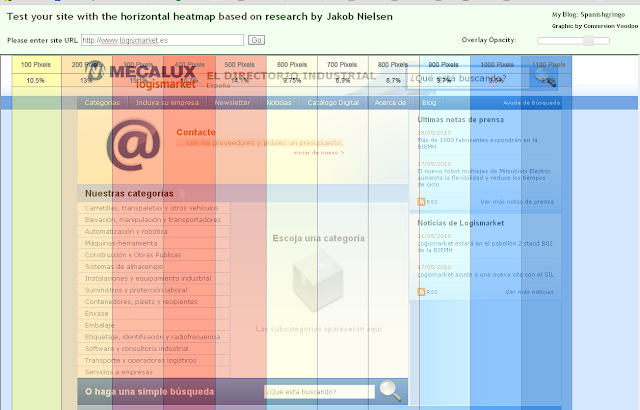
I read a very good post on grokdotcom recently that discussed looking out page layout in terms of horizontal optimization. It turns out that users have a "sweet spot" where they tend to fixate their eyes. Using eye tracking software, researchers can follow this eye movement on the page and create a heat map showing where users focus their attention. The post was based on research done by Jakob Nielsen, a recognized usability and UI design expert.

While the post included a link to a graphic overlay (created by Conversion Voodoo) that you can use to place over screenshots on your desktop (using Photoshop or Paint.Net, etc...), it seemed to me that you could pretty easily turn this concept into an online tool to more easily test many sites and pages in a browser.

So, with a modified version of the layout overlay graphic, a little bit of HTML, jQuery, and using Blogger's pages feature, I created an Online Heat Map Test for Horizontal Layout.

Horizontal Online Layout Test - HOLT
Logismarket is looking fairly optimized on the home page. Perhaps it needs a nudge to the right...

It is pretty easy to use & it's free:

  1. Enter the URL of a page that you want to test & click Go (or press enter)
  2. Drag the overlay graphic if you need to align it with your site (depending on screen resolution)
  3. Adjust the Overlay transparency, if needed
  4. Now look at the part of the site in red zone of the overlay. That is where users are naturally going to spend the most time focusing.

There is a link additionally in the sidebar navigation of this blog.

Please let me know what you think about it.

Friday, April 30, 2010

Suggest 4 Google Insights - Firefox Script & Chrome Extension

I have written a little greasemonkey script & Google Chrome extension that integrates Google Suggest with Google Insights for Search.

Why do this?
I wanted to speed up some keyword research that I was doing in Google Insights.

There are various research sources I use when doing KW research (such as Google Analytics data, competitor keywords, anchor text keywords, etc...), but sometimes I find that Google itself is a helpful resource for identifying other keyword candidates through its suggest feature. Its suggestions sometimes are terrible but on other occasions it provides insight (no pun intended) into similar phrases that users are using to search Google. After all, suggestions from Google Suggest are based on actual queries from users.


Highlights

  • Suggest results vary by language and country, so I took advantage of the existing country SELECT value from Google Insights to use that as the basis for the country parameter in Google Suggest
  • Since Insights has no language field other than for the whole interface, I decided to add my own SELECT with the available languages (I use the same list as is available for the UI, so it may not be complete for all suggest possibilities)
  • Suggest results are cached for improved performance in the browser
  • Arrow keys on the keyboard work the same as the mouse

Available for Firefox & Google Chrome
Enjoy. As always, please leave feedback in the comments and link to this post instead of directly to the extension and/or userscript. Thanks!

Monday, March 15, 2010

Google Analytics Evolution - Time Series GA Data using the API & App Engine

This project started with 3 main ideas:
  • Need to quickly pull visits, bounces, transactions by month for many sites? Check.
  • Want to rapidly chart sites' performance against each other? Check.
  • Need a simple interface to allow for getting data into Excel that any marketing person could use? Check.
I am happy to introduce Google Analytics Evolution. A new app hosted on Google's App Engine (for Java) using the Google Analytics API and Flot., a powerful jQuery plug-in for charting.

GA Evolution in Action
Reason for the app
I often have the task of slicing and dicing data for the many sites I oversee. at logismarket we operate our 16 sites in 15 countries. Using Google Analytics, the process of pulling data for reports across all of these sites, was a time-consuming and tedious task. Custom reports, advanced segments, and the great greasemonkey script, cleanerGAProfileSwitching, made things much easier, but I wanted to be able to work even faster. Additionally, any time that I wanted to see data over a longer period of time, my biggest pet peeve with GA, sampling, would rear its ugly head. Given the size of our sites and depending on the dimension or segment used, we can trigger sampling with only a few months of data. That makes using GA for measuring trends quite unreliable, especially for transactions, since the margin of error is much larger on the transactions than it is for visits (the basis of sampling in GA).

So when my boss asked me for a review of the last 18 months for all of our sites and to further segment the data into 3 different slices, I decided to start coding instead of pulling data right away. A little investment now in coding to get a big payback over time for me and anyone else who has the same kind of needs with GA.

Enjoy.


Examples of Usage
  • Site comparison: Pull data for the same period for 2 or more sites and click a column header to see the results in the chart
  • Segment comparison: Pull data from the same site (or more) and choose various segments for the same period and click to see the difference in the chart without the distortion caused by being forced to include All Visits (as it does in the GA UI). Also less likely to trigger sampling.
  • Quick data pull for multiple sites: Select all (or most) of your site profiles, get the data, copy and paste to Excel. Only minimal manipulation needed to get the data ready for Pivot Table usage :-D

Check out the free app today

Ideas for Future Expansion
While this app currently meets my needs I have identified some areas that I want to expand and improve the app. I am also open to suggestions. Please add a comment to this post or report an issue on the Google Code project page for GA Evoluation.
  • Add export to CSV feature. I am thinking to do this along similar lines as the charting... where you export the data that is already pulled and you select the tables. That way you know what you are going to get (eg, you can check Confidence Interval to make sure sampling was not triggered).
  • Make the metric selection dynamic with a set of default metrics. You can greatly expand the reporting capabilities, but I need to make sure that the reporting stays correct (keep apples to apples in charting of the data).
  • Add some calculated metrics not in API. Bounce Rate, eCommerce Conversion Rate are not available via the API because that info can be calculated after pulling the data. No need to burn free Google cycles when we can just calculate it ourselves. However, it would be more user friendly to have the option to get the data as we want it, not just as it is given to us by Google.
  • Other enhancements to flot charts. These are not fully defined yet, but I am thinking toward making the charts a bit more dynamic... still need some thought here.

Monday, March 8, 2010

Let it snow let it snow let it snow


I woke up this morning and this is what I saw.

The access to the freeway was closed off so that meant work from home ;) I realize that in other countries and parts of the states, this would just be any other Monday in Winter, but here... they are not prepared (much like when it rains in LA).

The snow has not stopped all day. Sometimes light. Sometimes heavy, but it has not stopped. Too bad that it is so cold because the sea forecast predicts some big big waves (up to 7 meters), which are not too common for the western med.

Schools here are closed and even the city hall is handing out letters to justify people's absences from work.

Luckily we still have our power, internet connection and especially natural gas to keep the house toasty.

Here are a few more photos and a video of the snow. Tomorrow should be spectacular since the skies are supposed to be clear and hopefully we get a great show of Montserrat.